DataView Display Modes Screen
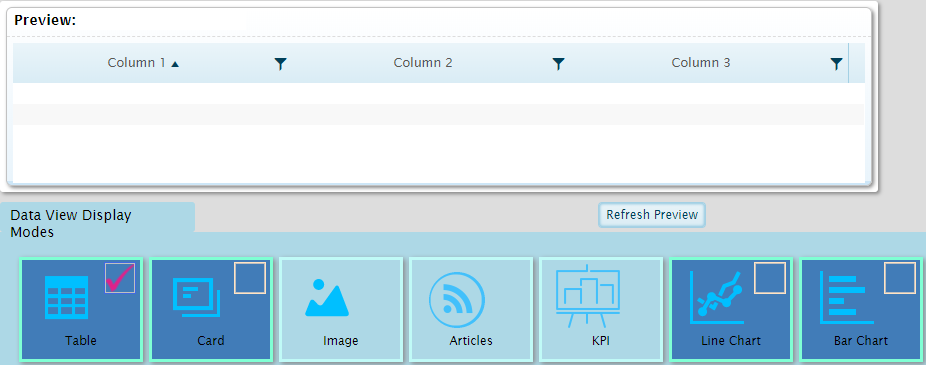
The Display option switches to the DataView Display Modes selection screen. This screen is used to select which display modes are appropriate for the data in the current dataview. Display modes that are enabled in this screen will be available for selection in the dashboard configuration and analysis modes.

The screen is composed of two sections.

The Preview section shows how the data will appear with the current settings. Click the Refresh Preview button to show the display mode selected as the default. Note that some view modes require additional settings that are only available in dashboard configuration or analysis modes, and cannot be displayed in the preview section.

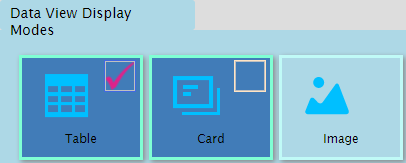
The Data View Display Modes section displays all available view modes. Click on a display mode to enable (dark blue) or disable (light blue) each view mode. Click the box within an enabled view mode to make it the default mode.
Each display mode has specific data requirements, detailed below. Display modes that do not match the data should not be enabled.
| Table |
This is the standard table display, and can be used with any data that is organized into columns and rows. |
| Card |
Displays the data as a series of cards, with one card for each row of data. This requires data to be organized into columns and rows. |
| Image |
This feature is not in use. |
| Articles |
Displays RSS feeds such as news. This requires an RSS configuration. |
| KPI |
The Key Performance Indicator (KPI) report displays one record at a time, providing a single value from that record. An optional chart can be included to display trend values. This requires table data with one numerical column to serve as the Value Column and another column to provide the Trend Values. The data in the Trend Values must be comma-separated numerical values, without any spaces. Since the KPI report can only display one record at a time, criteria must be configured to filter the results. |
| Line Chart |
A chart showing lines connecting data points across a horizontal category axis. This requires table data with one column to serve as the Category Column and at least one numerical column to provide the data points. Only numerical columns will be charted as data points, even if other columns are present. |
| Bar Chart |
A chart showing horizontal bars representing data points arranged on a vertical category axis. This requires table data with one column to serve as the Category Column and at least one numerical column to provide the data points. Only numerical columns will be charted as data points, even if other columns are present. |
| Column Chart |
A chart showing vertical bars representing data points arranged on a horizontal category axis. This requires table data with one column to serve as the Category Column and at least one numerical column to provide the data points. Only numerical columns will be charted as data points, even if other columns are present. |
| Area Chart |
A chart showing lines connecting data points across a horizontal category axis, with the space between the line and the axis filled in with color. This requires table data with one column to serve as the Category Column and at least one numerical column to provide the data points. Only numerical columns will be charted as data points, even if other columns are present. |
| Pie Chart |
A circular chart divided into segments. This requires table data with one column to serve as the Category Column and one numerical column to define the segments. Any other columns will be ignored. |
| Donut Chart |
A ring-shaped chart divided into segments. This requires table data with one column to serve as the Category Column and one numerical column to define the segments. Any other columns will be ignored. |
| Radar Chart |
A chart showing lines connecting data points around a circular category axis. This requires table data with one column to serve as the Category Column and at least one numerical column to provide the data points. Only numerical columns will be charted as data points, even if other columns are present. |
| Tree Map |
A series of bars or squares with sizes relative to the selected value. This requires table data with one column to serve as the Label Column and one numerical column to define the relative sizes of the bars or squares. Note that the dataview must be set to Show Subtotal Rows and the Subtotal Levels must be set to at least Level 1. |
| Radial Gauge |
A round gauge with a configurable range, containing one or more pointers displaying values within that range. This requires table data with one numerical column to provide the data points. Other columns can be included in the table for filtering and grouping purposes, but will not be used in the gauge. |
| Linear Gauge |
A horizontal or vertical line gauge with a configurable range, with a colored line displaying a value within that range. This requires table data with one numerical column to provide the data point. Other columns can be included in the table for filtering and grouping purposes, but will not be used in the gauge. |
| Map |
Displays a map that can include markers for areas, locations, and associated data. This requires table data with latitude and longitude information. |
| Weather Card |
Displays weather data. This requires a weather data configuration. |
| HTML |
Displays custom HTML content. This requires a single entry containing the full HTML content. Note that JavaScript and similar code is not supported. |


